
JUAN ALMONTE
Welcome to my Data Analysis Portfolio, where I showcase my proficiency in Excel, Power BI, and Tableau. As a data enthusiast, I'm dedicated to transforming raw information into actionable insights that drive informed decision-making. This portfolio is more than a collection of projects; it's a testament to my dedication to harnessing the power of data for strategic advantage. Whether you're interested in exploring my data analysis journey, seeking inspiration for your own projects, or looking to collaborate on future endeavors, I invite you to delve into the contents of this portfolio. Together, let's unlock the insights that data has to offer and drive positive change through informed decision-making.
Customer Segmentation Analysis
(Power BI)
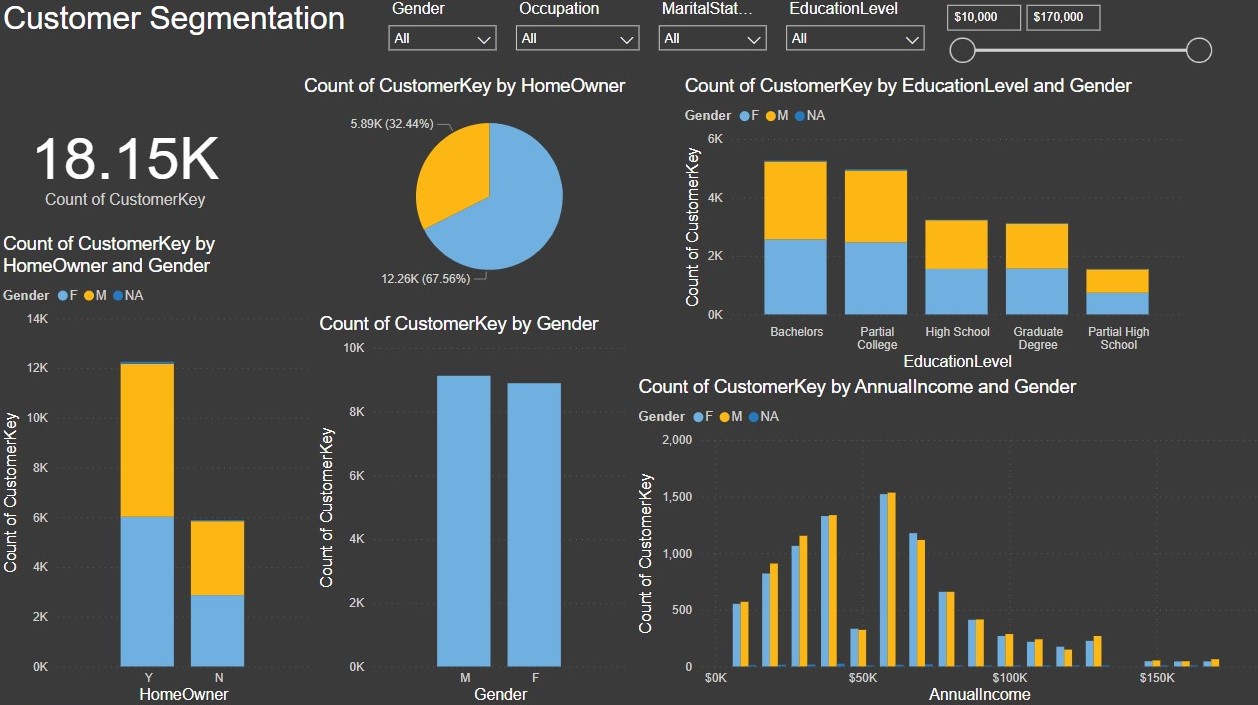
By segmenting customers based on homeownership, education, gender, and income, we have gained valuable insights into their preferences and behaviors. This nuanced approach to customer segmentation equips us to create tailored marketing strategies, product offerings, and pricing structures. As a result, we can better meet the diverse needs of our customer segments, maximize customer satisfaction, and drive sustainable business growth. In an increasingly competitive landscape, leveraging these insights is paramount to staying ahead in the market and forging stronger customer relationships.
Human Resources Trainings Dashboard
(Excel)
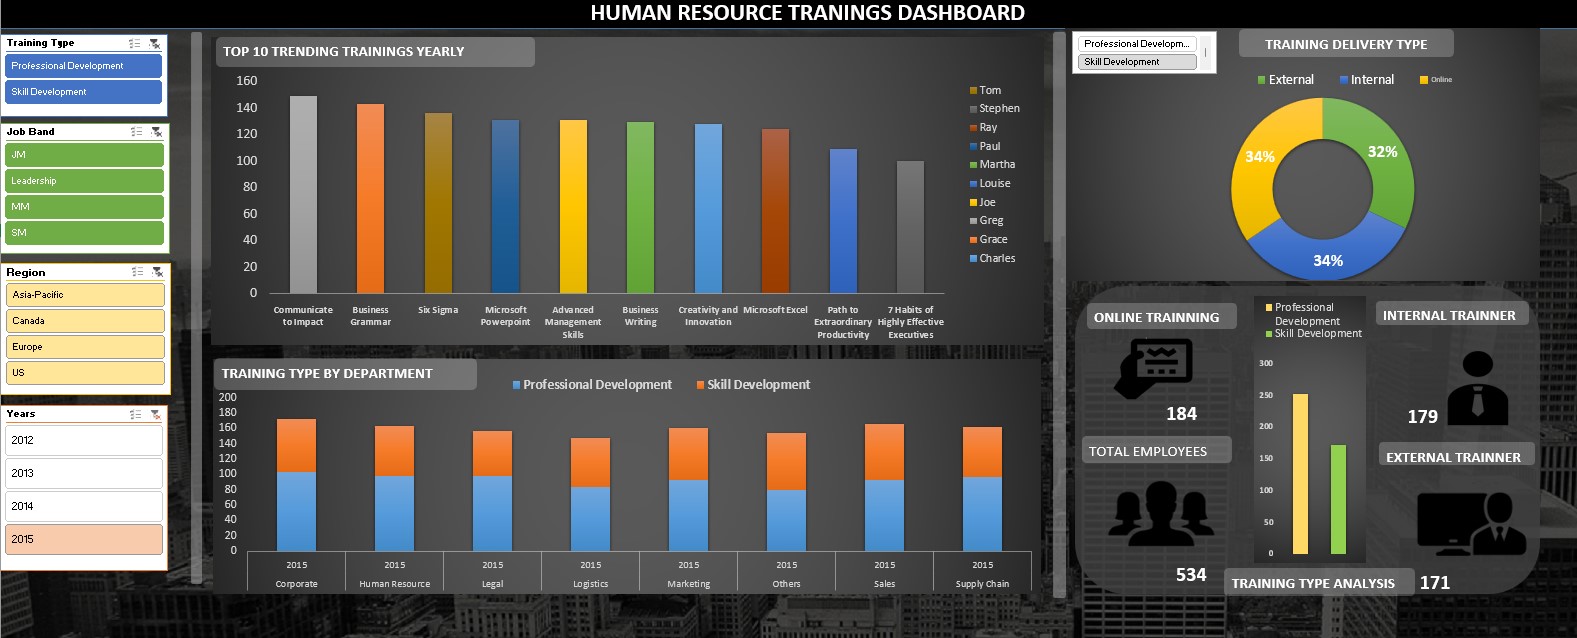
The data highlights the importance of training and development programs within the organization, with a focus on both skill development and professional development. It also indicates areas for potential improvement, such as increasing training initiatives in departments with lower session counts and diversifying the delivery methods of training sessions.
Bike Sales
(Excel)
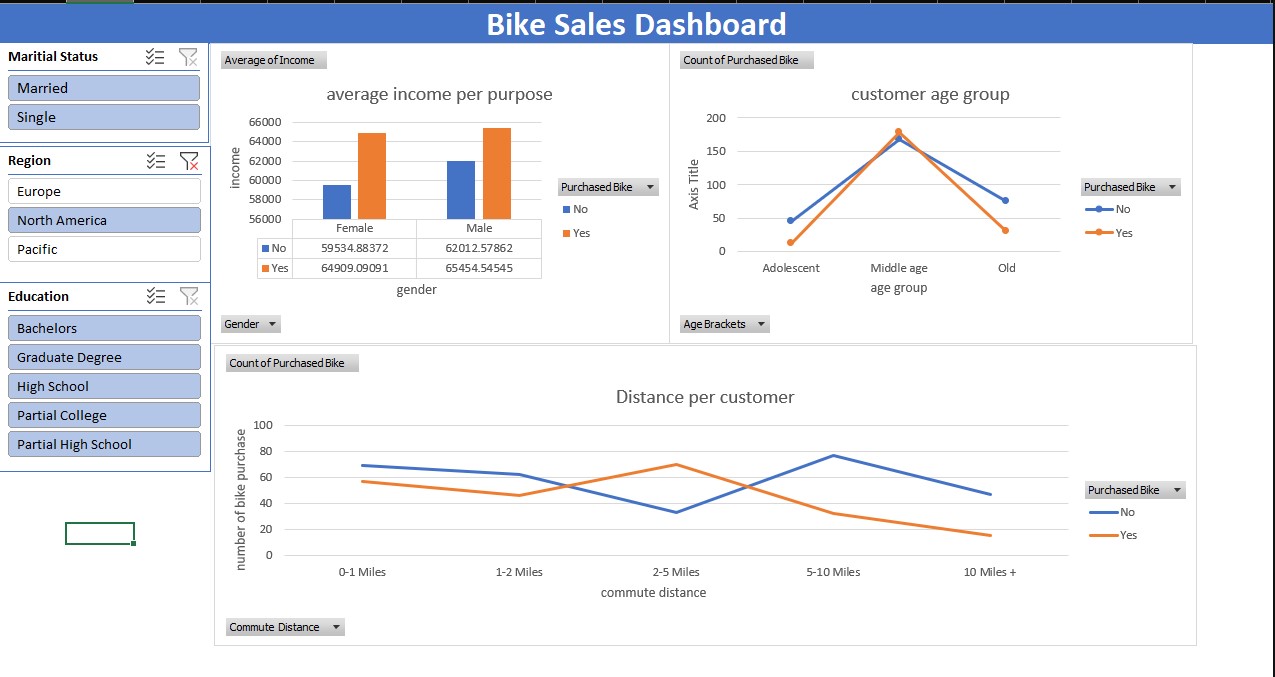
Based on the data provided, it's evident that there is a correlation between income levels and bike purchases. Individuals with higher average incomes tend to be more inclined to purchase bikes, as reflected in both genders. Specifically, females and males who have purchased bikes exhibit notably higher average incomes compared to those who have not. Additionally, analyzing the count of bike purchases by distance range reveals interesting patterns. The majority of bike purchases occur within shorter distance ranges, such as 0-1 miles and 2-5 miles, while fewer purchases are observed for longer distances exceeding 10 miles. This trend suggests that individuals may prefer bikes for shorter commuting distances rather than longer journeys. Overall, these insights shed light on the relationship between income, bike purchases, and preferred biking distances, providing valuable information for understanding consumer behavior in the context of transportation choices.
Anual Sales Analysis Report
(Excel)
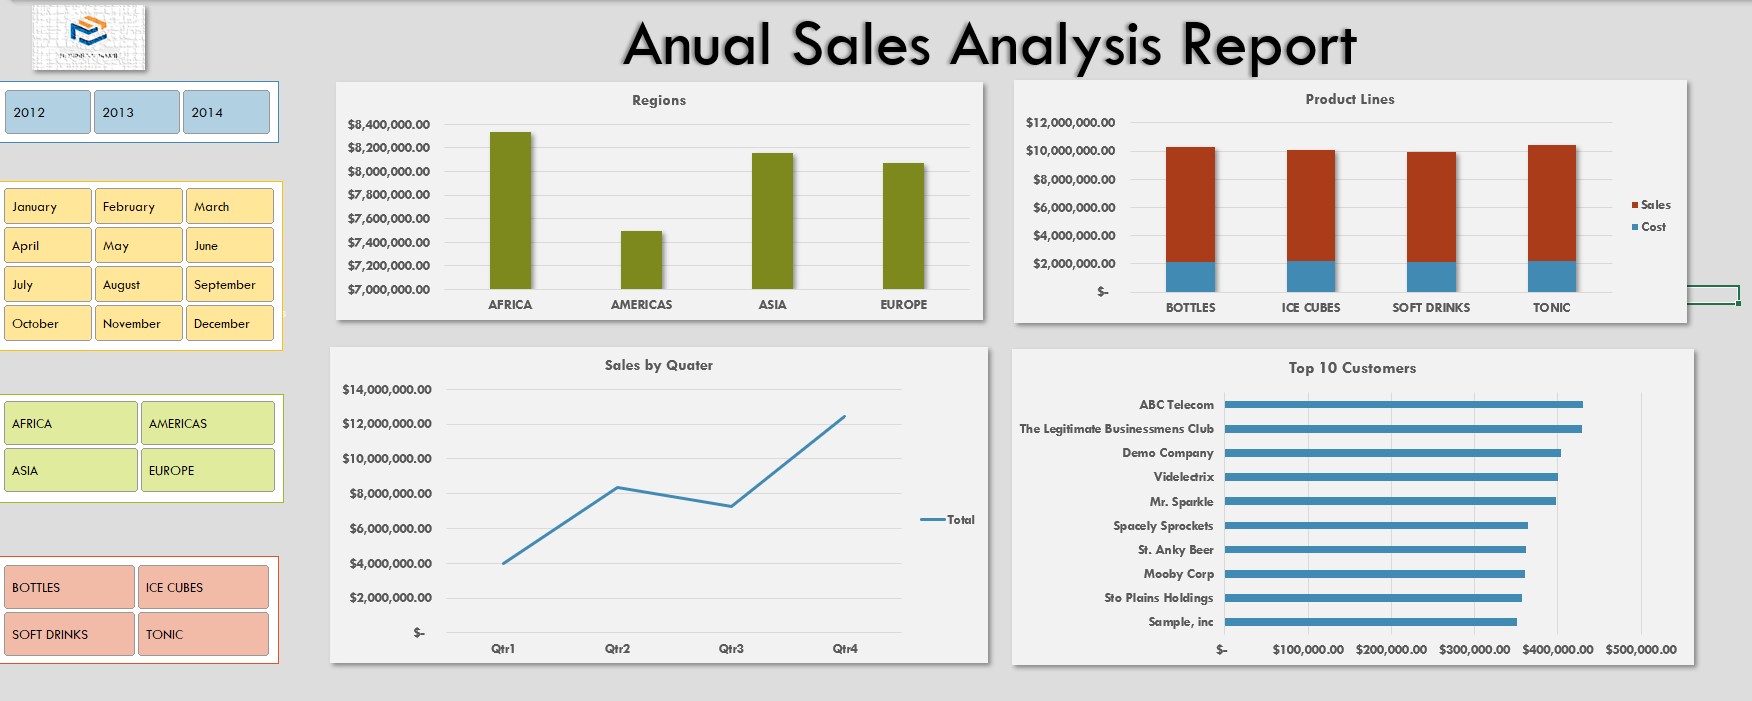
Analyzing the company's sales and costs across various product categories, sales volume ranges, and customer segments reveals important insights for strategic decision-making. Tonic emerges as the top-selling product category, closely followed by Soft Drinks and Bottles. However, Tonic also incurs the highest costs, highlighting the importance of cost management despite high sales. On the other hand, Ice Cubes, while having slightly lower sales, exhibit relatively lower costs, indicating potentially higher profit margins. In terms of sales volume, the 70000-79999 range dominates, followed closely by adjacent brackets, suggesting consistent sales activity across different segments. Among customers, The Legitimate Businessmens Club and ABC Telecom stand out for their significant contributions to total sales, while Sample, Inc. and Sto Plains Holdings present opportunities for targeted growth strategies. These insights provide a foundation for strategic initiatives aimed at optimizing product offerings, refining pricing strategies, and targeting specific customer segments to drive profitability and revenue growth.h
Worldwide Video Games Sales
(Tableau)
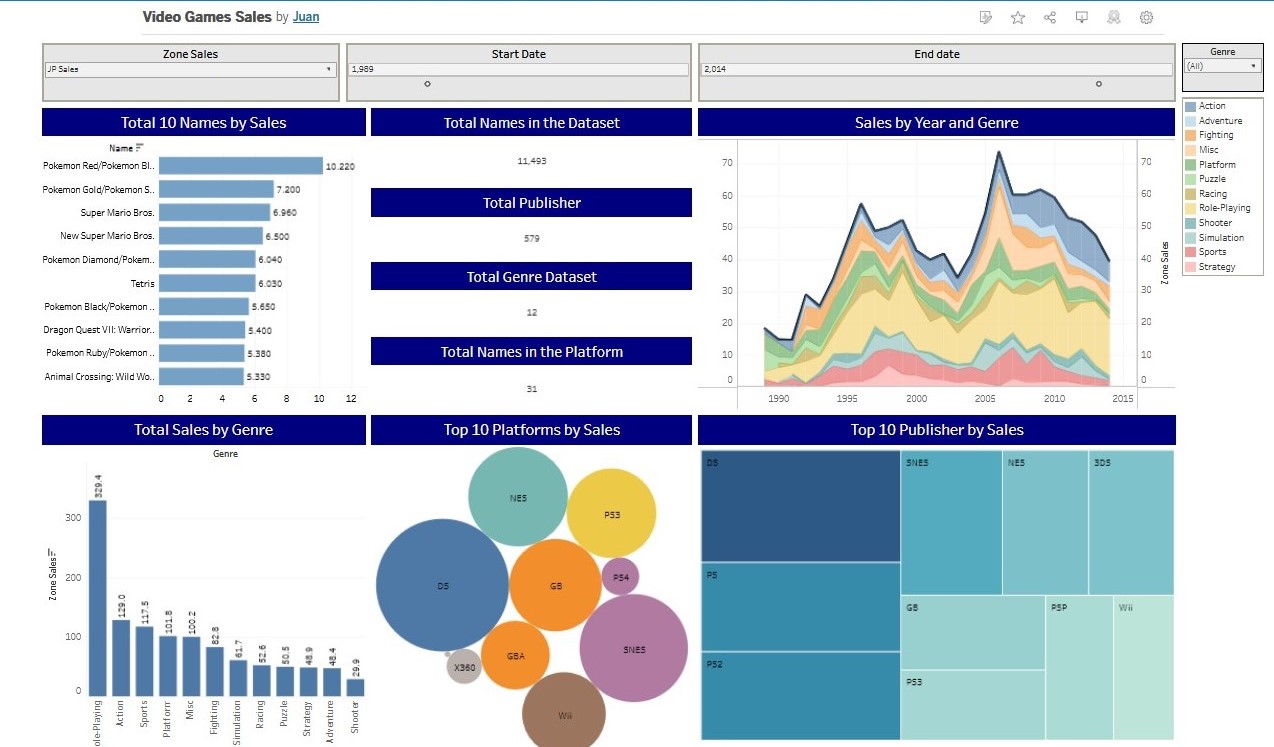
Analyzing global video game sales reveals fascinating insights. The industry's incredible growth is driven by diverse player profiles, allowing for tailored marketing and game design. Telemetry data not only enhances gameplay but also informs developers about player behavior. Monetization strategies, finely tuned with data, cater to player preferences. Smart acquisition decisions are made by optimizing marketing budgets based on data-driven predictions. Strategies focused on player retention, informed by analytics, boost loyalty. Careful balancing of in-game elements is achieved through data analysis, ensuring an enjoyable experience. Staying ahead of market trends with data-driven insights is crucial for sustained success. Robust cheating detection systems maintain fairness and competitiveness. Predictive analytics prepare the industry for shifts and emerging opportunities. In the world of video games, data is the key to conquering challenges and leveling up.
Comprehensive Business Performance Dashboard
(Excel)
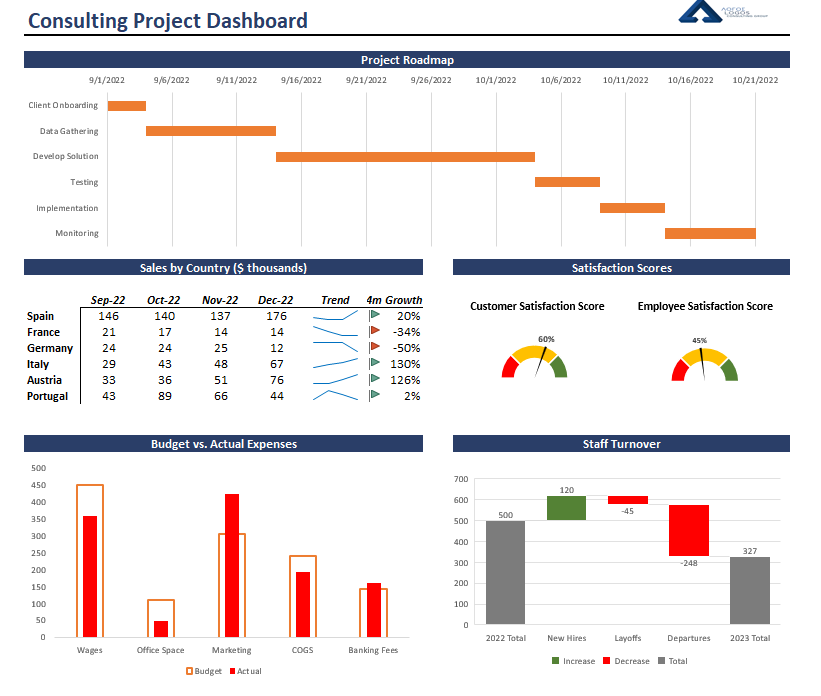
The Comprehensive Business Performance Dashboard provides a panoramic view of our organization's health, allowing us to navigate toward success with precision. It acts as our compass, blending vital elements such as customer satisfaction, employee morale, sales dynamics, budget adherence, and actual expenses onto a single, intuitive map. Through this integrated visualization, we gain the power to plot our course with confidence, ensuring alignment with strategic objectives. As we journey forward, it becomes evident that the interplay of these factors profoundly impacts our trajectory. By keeping a vigilant eye on this comprehensive dashboard, we unlock insights that empower us to make informed decisions, optimize resources, and chart a prosperous future. .
IMDb Movie Insights: Exploring Actors, Years, Writers, and Genres
(Tableau)
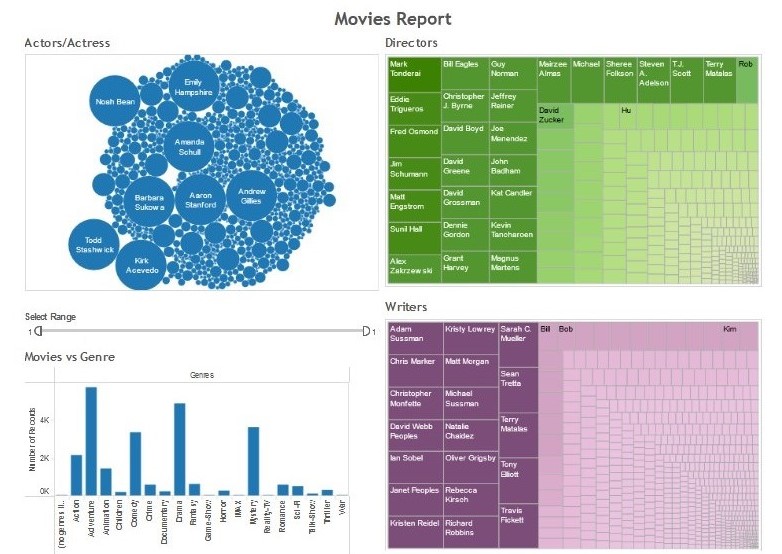
Analyzing IMDb movie data reveals intriguing insights. Over the years, we've seen the emergence of diverse genres, with a notable surge in recent years. Talented actors, both seasoned and newcomers, have played pivotal roles in bringing these genres to life. Writers, often the unsung heroes, have crafted captivating narratives that keep audiences engaged. Exploring this rich tapestry of data offers a deeper understanding of how cinema has evolved, highlighting the ever-changing landscape of storytelling and the creativity that drives the film industry forward.
Regression Analysis
(Excel)
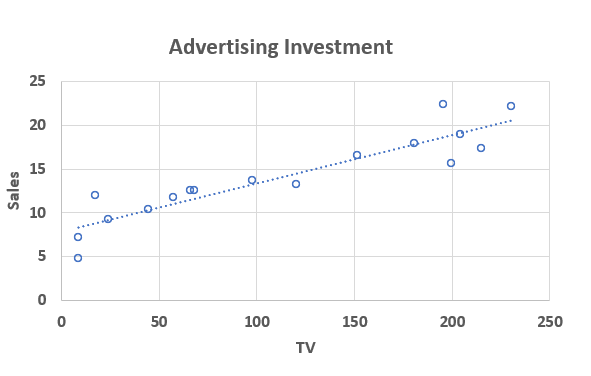
The positive correlation between TV advertising costs and sales revenue suggests that as businesses allocate more resources to television advertising campaigns, they tend to experience higher sales revenue. This insight underscores the importance of television advertising as an effective means of promoting products or services and driving business growth. Further analysis and optimization of advertising strategies may provide opportunities for businesses to capitalize on this positive correlation for enhanced financial performance.
Incentive Effectiveness Analysis
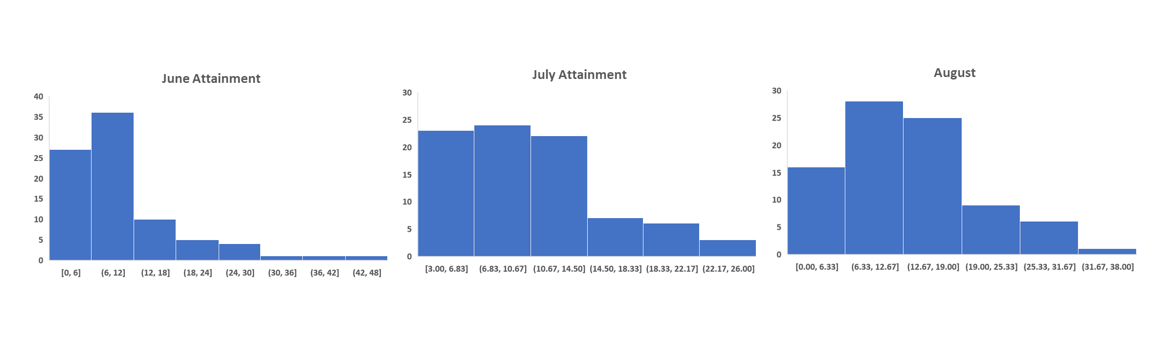
Before the incentive program, in June, we were selling an average of 10.98 cell phone lines each day. In July, this number went down slightly to 10.45. But in August, after starting the incentive program, we saw a big increase. We were selling an average of 13.13 mobile phone lines per day. That's a big 27% increase from July to August! So, the program really helped us sell more mobile lines.
Product Order Summary Dashboard
(Power BI)
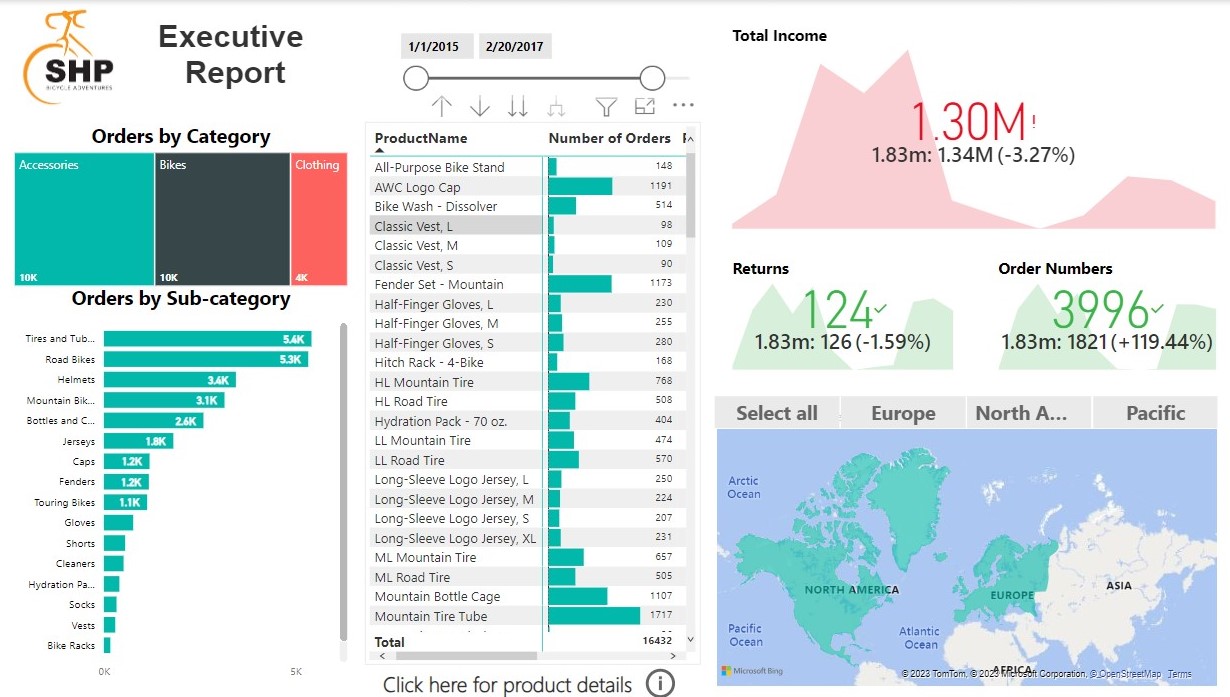
Our dashboard segments orders into categories and subcategories, streamlining data management. Identifying top-selling products and monitoring order volumes helps us make informed decisions about inventory and marketing strategies. Leveraging these insights will drive growth and profitability.
Cookies Performance Dashboard
(Excel)
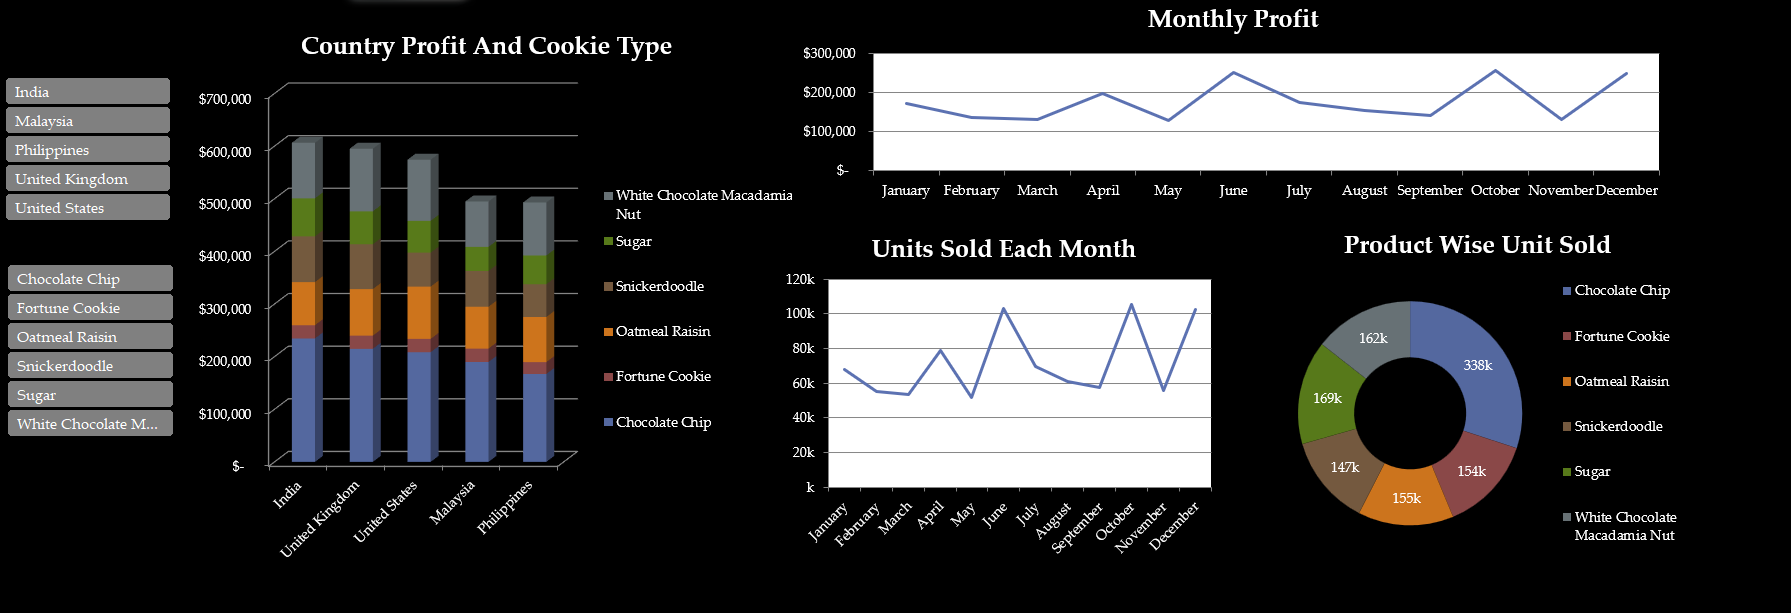
The results of the cookie sales show a strong performance with a notable increase in revenue. This success can be attributed to effective marketing strategies, a high demand for our products, and a well-executed sales team effort. The data indicates a promising future for our cookie business, with the highest profits consistently recorded in the months of June and October.
Incentive Effectiveness Analysis
(Excel)
Before the incentive program, in June, we were selling an average of 10.98 cell phone lines each day. In July, this number went down slightly to 10.45. But in August, after starting the incentive program, we saw a big increase. We were selling an average of 13.13 mobile phone lines per day. That's a big 27% increase from July to August! So, the program really helped us sell more mobile lines.